Classroom · Finance
Same average. Same risk?
Give everyone the same two assets and scenario table. Ask for an allocation they can explain, reveal what the mixtures changed, then let the class redesign for a stated risk objective. One shared illustrated outcome separates a good result from a low-risk decision.
- Up to 600 people
A practice run with fictional students. No real classroom or join code is created.
Try an answer on the phone. Lead the lesson from the screen.
On their phone
You are presenting

Setting up the room…
Lesson deck
Teach it as a ready-made lesson
Hook, how it works, the live game and takeaways. Edit anything.
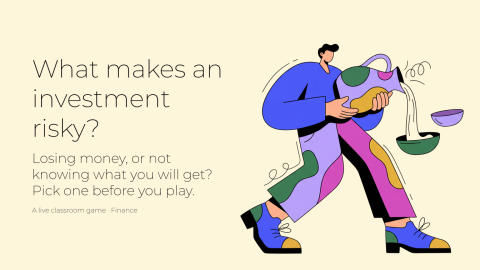
What makes an investment risky?
A ready-to-teach lesson deck: a hook, how it works, the live game and takeaways for the debrief.
6 slides · 1 activity
What it teaches
Students distinguish probability-weighted expected return, volatility across a finite scenario population and the return in one illustrated row. They test whether equal asset averages imply equal portfolio risk, explain diversification using co-movement, and revise a complete allocation without erasing their first choice.
- Diversification
- Risk and return
Debrief, while the boards are still up
- 01
Which quantities changed across the allocations, and which stayed the same?
- 02
How does the joint scenario table explain what mixing the assets does to volatility?
- 03
Does the lowest-variance allocation earn the most in the illustrated row? Why are those different questions?
- 04
What assumptions would you need before applying this classroom model to real investments?
How it works
- 01
Add it to your library
Sign up free and pull the activity from Decka's built-in classroom catalog — one click copies it into your own library, ready to run from Decka or inside PowerPoint.
- 02
Students join by QR
Everyone scans from the projector and plays in their phone's browser. No app, no account, nothing to install.
- 03
You run the room
You move the activity phase by phase: collection closes, the boards resolve on the big screen, and the debrief happens while the results are still up.
A portfolio diversification game built around two decisions
Begin with a common scenario table, not a price forecast. Every student sees the same probabilities and asset returns and submits one complete allocation totaling the displayed budget. The first choice asks for a reasoned preference, not a hidden correct answer. The teacher decides when to close collection and move on.
Once the first choices are sealed, the shared screen shows the risk–return opportunity set and anonymous allocation counts. Students see their own exact allocation and results privately. The chart’s minimum marker refers only to variance under this table and the permitted allocation bounds; it does not identify the best investor.
The teacher then reveals one common illustrated row chosen when preparing the lesson. It is not a random draw. Compare its realized return with the average and volatility across all rows before asking for a second allocation that minimizes variance. Both decisions use the same model and illustrated row: there is no second market outcome or surprise draw.
The final comparison retains both answers. A student who missed the first choice may still make the second, but paired change statistics include only students with both. Anonymous frequency bars show allocation ranges, not individual students or probabilities of investment returns.
Try the screen-and-phone preview above with fictional classmates, who submit their allocations through the same runtime as the lesson. You run the projector’s steps and play one student’s phone, entering a complete allocation of your own, and you can run it again once it ends. The separate free portfolio calculator explores other hypothetical assumptions, but does not transfer settings into this lesson.
FAQ
Teaching diversification without confusing risk and luck
Is this suitable for an introductory finance class?
Yes, once students can compute a weighted average. Start with the table and verbal explanations of how asset returns move together. Advanced undergraduate and MBA classes can use the available weighted-variance or covariance explanation and discuss feasible allocation bounds and model assumptions.
Does the lesson simulate real markets or invest money?
No. It uses an explicitly authored finite scenario population for one hypothetical period. There are no live prices, random market draws, trading recommendations or real-money transactions.
Can the teacher change the scenario table?
Yes. Customization exposes asset and scenario labels, probabilities, returns, the common illustrated row and lesson controls. Validation keeps the probabilities and complete allocations internally consistent. Changing assumptions can change the mathematical conclusion; the lesson does not promise diversification will always reduce risk.
What happens if someone misses a choice?
They can still submit the later attempt. Each wave retains its own answer and missing counts. Only students with both accepted allocations contribute to the paired comparison, and missing answers are not treated as zero-percent allocations.
Is a higher illustrated return evidence of a better decision?
Not by itself. The illustrated row is one common outcome, while variance uses all rows and their probabilities. The redesign asks for minimum variance under the stated model, not the highest payoff after seeing which row is illustrated.
Do students need an app or an account?
No. Students scan a QR code from the projector (or open a link) and play in their phone's browser. Nothing to install and nothing to sign up for.
Does it work in PowerPoint or Google Slides?
In PowerPoint, yes: open the Decka add-in on a slide and choose the Classroom tile. Google Slides is not supported yet; there you present from Decka itself. Students play from their phones either way.
How many students can play at once?
Up to 50 participants per live activity on the free plan, 150 on Pro, and 300 on Badass.
Ready to make your
presentations interactive?
Start free. No credit card required.